In Wagga Wagga, many sites sitting on the alluvial clays and sands of the Murrumbidgee floodplain mask a highly variable bedrock surface beneath. The transition from the Silurian metasediments of the Lachlan Fold Belt to the deeper Quaternary sediments can be abrupt, and assuming a uniform interface based on a handful of boreholes has led to more than one excavation surprise. Seismic tomography (refraction and reflection) lets us trace that contact continuously, providing a velocity model that feeds directly into rippability assessments, seismic site class (AS 1170.4), and earthworks planning. Where the water table sits shallow — typical in East Wagga — the P-wave refraction picks up the saturated velocity contrast clearly, but the real value often lies in the shear-wave section derived from a MASW survey run along the same spread. When the brief requires both deep structure and near-surface stiffness for a deep excavation design, we combine a reflection line with a high-resolution refraction grid.
A velocity jump from 1200 m/s to 2500 m/s across the Murrumbidgee paleovalley tells you more about excavation cost than any borehole log on its own.
Technical details of the service in Wagga Wagga
Critical ground factors in Wagga Wagga
The 2019 Snowy Valleys earthquake sequence, with a M4.4 event felt in Wagga Wagga, reminded the engineering community that the city sits on a seismically active margin of the stable continental crust. AS 1170.4 assigns a hazard factor (Z) of 0.09 for the region, but site amplification is controlled entirely by the upper 30 metres. A misinterpreted velocity profile can push a site from Class C (shallow rock) to Class D (deep soft soil), doubling the design spectral acceleration and adding tens of thousands to the structural frame. The risk is acute along the floodplain between North Wagga and Gumly Gumly, where 20-plus metres of soft alluvium overlie fractured bedrock with lower-than-expected P-wave velocities. A reflection survey that fails to resolve a buried paleochannel can leave a liquefaction assessment blind to a high-risk lens. Our team cross-checks every seismic line with existing borehole logs from the NSW Smooth Geology database to ground-truth the velocity inversion, an extra step that has caught several anomalies before they reached the foundation design desk.
Our services
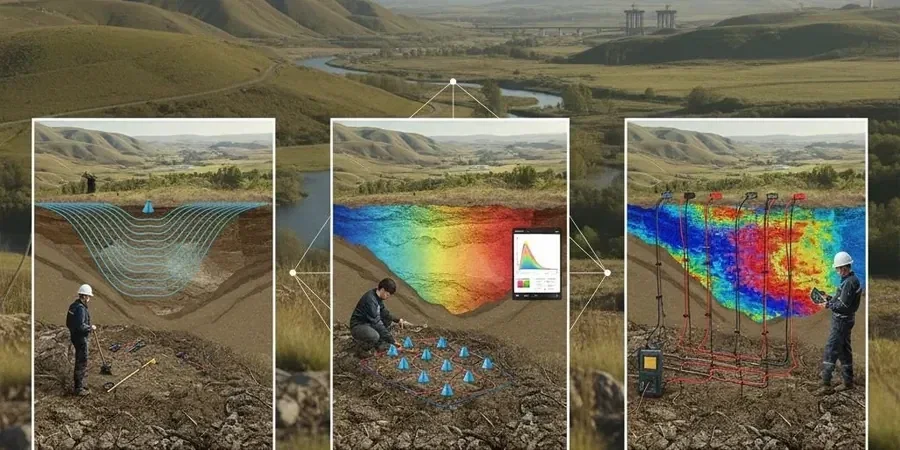
The seismic tomography service we deliver in Wagga Wagga covers two complementary methods, each suited to different site constraints and investigation goals. Both are executed with wireless nodal seismographs that cut deployment time on residential blocks, and the deliverables include velocity tomograms, ray-path coverage maps, and a geotechnical interpretation report written by an engineer who understands the local geology.
Seismic refraction tomography (SRT)
A 24- or 48-channel spread with hammer source. Ideal for mapping top-of-rock, estimating rippability, and assigning AS 1170.4 site class. We process with SeisImager and deliver 2D P-wave and S-wave velocity models, plus a table of interpreted layer velocities tied to your survey datum.
Seismic reflection profiling
Higher-energy weight-drop source and longer spreads for targets beyond 30 metres depth. Used where a detailed stratigraphic section is needed — for example, to map the base of a paleochannel beneath a proposed bridge pier or a retaining wall alignment. Output is a stacked time section converted to depth using borehole or refraction velocity control.
Top questions
How much does a seismic refraction survey cost for a residential block in Wagga Wagga?
For a standard residential lot requiring a Vs30 classification or bedrock depth to 15 metres, the fee typically ranges between AU$3,800 and AU$8,630. The exact figure depends on the number of geophone channels, source type (sledgehammer vs. weight drop), and whether shear-wave data is collected alongside the P-wave line. Access constraints — such as steep slopes in Estella or tight backyards in Turvey Park — can also influence the final quote because they dictate how the spread can be laid out.
What is the difference between seismic refraction and MASW for site class?
Seismic refraction gives you a P-wave velocity model and can map layer boundaries, including the top of rock. MASW, which we often run using the same equipment spread, directly produces a shear-wave velocity profile (Vs) that feeds into the NEHRP site-class calculation. In Wagga Wagga's floodplain environment, P-wave velocities can be influenced by the water table — saturated silts look deceptively fast — while MASW avoids that ambiguity. We frequently combine both on a single line to satisfy AS 1170.4 requirements with a higher level of confidence.
Can seismic refraction work on asphalt or concrete surfaces in the city?
Yes, but it requires a different coupling approach. On hardstand surfaces such as warehouse slabs in Bomen or the tarmac at the airport, we use a three-component geophone with a disposable putty coupler and a smaller hammer plate to avoid surface cracking. The velocity of the concrete or asphalt layer is usually high enough that it does not mask the underlying soil velocities, though we flag the near-surface 2–3 metres as potentially influenced by the rigid pavement in the interpretation report.